BDSwiss App
Download & start trading

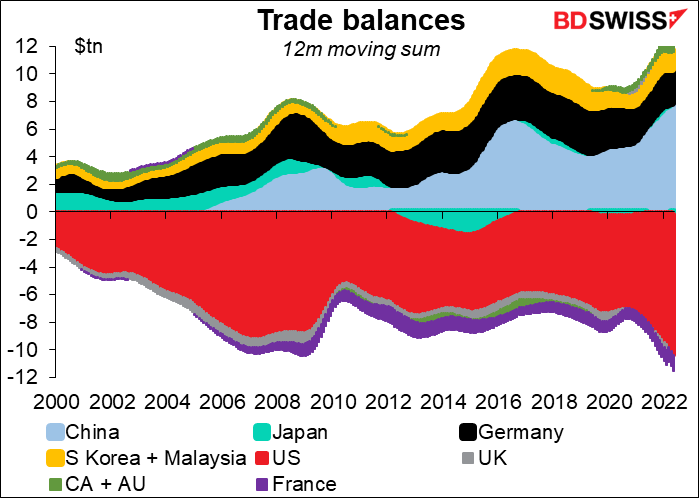
We got lots of trade and current account data this past week: German trade balance (Mon), the Australia trade balance, US trade balance (merchandise & services), Canadian merchandise trade (Thu), and Japan current account data (Fri).. Trade used to be the key for foreign exchange markets many many years ago, when financial flows were largely to finance trade. But now financial flows dominate the global economy and determine trade flows.
How does that work? Most people think of trade surpluses & deficits in the following way. The hard-working Germans who make excellent cars are the source of that country’s trade surplus (which we learned on Monday has disappeared, but never mind) while the spendthrift Americans, borrowing and spending money they don’t have, are the source of the perennial US trade deficit. This is the logic that says tariffs, market access agreements, and urging Americans to work harder and save more are the way to rectify these global imbalances.
That may have been the way the global economy worked many years ago, but not anymore. On the contrary, trade flows nowadays are the result of financial flows. Financial flows in turn are the result of political decisions to favor one group of people (normally the wealthy elite) over another group (the workers).
For example in a country like Germany, the workers don’t get paid enough to buy everything that they produce, a direct result of the Hartz Reforms of 2003/05 and the decision to focus on “competitiveness.” The country therefore has to export its excess production. Furthermore, the profits of these companies go to people with a low propensity to consume (the wealthy), who save much of their income rather than spending it. But with domestic demand suppressed, there aren’t enough investment opportunities in Germany. They therefore have to put their savings abroad instead. That money flooding into other countries affects interest rates and the willingness of banks to lend in those countries and thereby distorts their economies.
That’s why although Germans may criticize the spendthrift ways of Spanish homebuilders and the Greek government, the bubbles that inflated and then popped, wreaking havoc on those countries, would never have been possible if excess German savings hadn’t pushed real interest rates in those countries down dramatically and made it so cheap to borrow.
In this global system, where one country’s surplus is another’s deficit, the US winds up as the “borrower of last resort” for countries with excessive savings. Its position as the major reserve currency forces it into the position of having a perennial current account deficit (the counterpart of its constant financial account surplus). What former French President Valery Giscard D’Estaing described as an “exorbitant privilege” is really an “extraordinary burden.”
In other words, while the trade account used to be the dog that wagged the financial account tail, now the financial account is (generally speaking) the dog that wags the trade tail.
For anyone who wants to understand this process, I strongly recommend reading Trade Wars Are Class Wars: How Rising Inequality Distorts the Global Economy and Threatens International Peace, by Prof. Michael Pettis and Matthew C. Klein. It will revolutionize how you think of trade and global economics.
In any case, what should we make of the German merchandise trade deficit in May, the first since 1991?
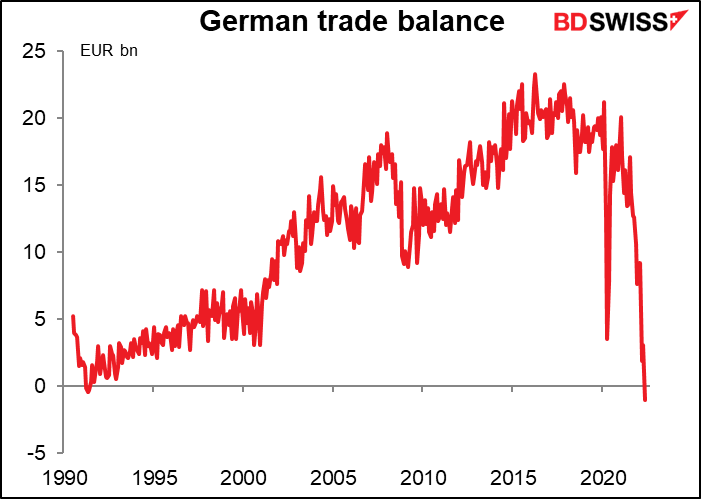
Having said all of the above…sometimes the trade account is the dog and the financial accounts are the tail. Today may be one such time as the surge in energy prices combined with the slowdown in the global economy throws the German trade account into deficit.
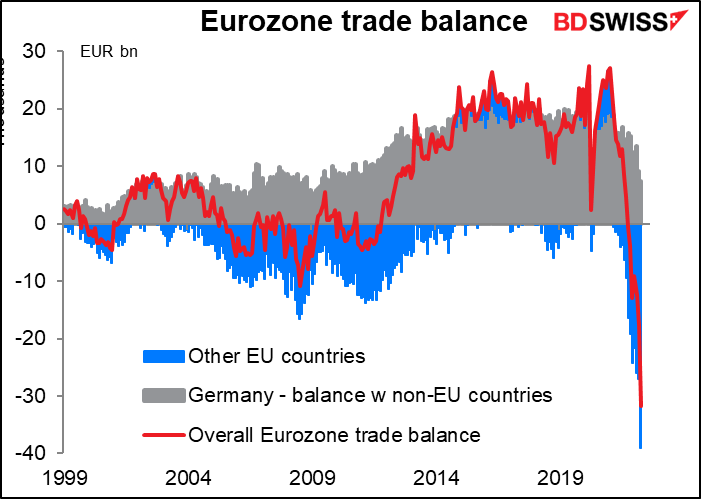
This spells some danger for the euro. Germany has usually accounted for all if not more than all of the Eurozone’s trade surplus – it generally offsets the trade deficits of the other countries. (The chart only goes up to April and does not include May’s German trade deficit.)
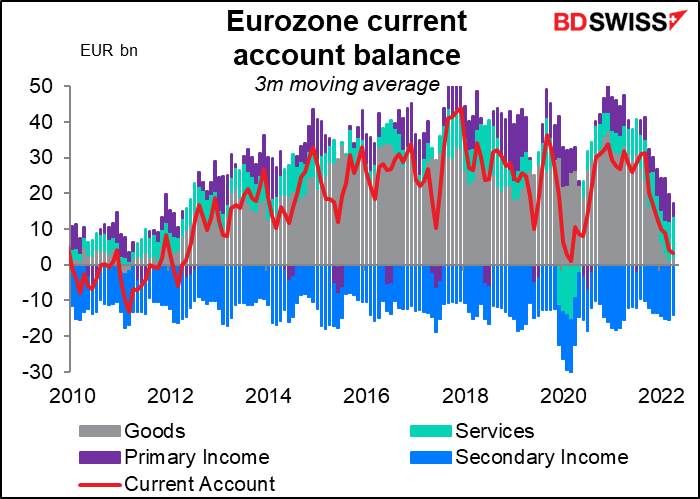
Of course, that’s only the merchandise trade account. We have to know what’s happening with services and the various income accounts that make up the current account balance. Lo and behold, that’s a deficit too (this chart shows a 3-month moving average and so it hasn’t yet dipped into deficit, but the Eurozone current account was in deficit by EUR 5.4bn in April.) Looking at what’s happening recently with Germany’s trade in goods, the Eurozone current account deficit is bound to widen as higher energy prices push the trade account further into deficit.
Now as we all know, the balance of payments has to balance. The money coming in always equals the money going out. If there’s a current account deficit (= Europeans spending more money abroad than they receive) then the country has to run a financial account surplus (= more money coming into European financial assets, such as stocks, bonds, land, etc.) than is going out. If not, then in a floating exchange rate regime such as we have, the currency will adjust to make it balance. The euro will fall to the point that either Europeans buy fewer goods abroad and foreigners buy more European goods, or European assets become so attractively priced that foreigners start to buy them.
Here’s where it gets tricky. What European assets would you recommend buying right now to ensure that the balance of payments balances?
Stocks? That hasn’t been a good idea over the last five years (past performance is no guarantee of future performance, of course).

Bonds? You’d have to take some credit risk to get a competitive yield on Eurozone bonds.
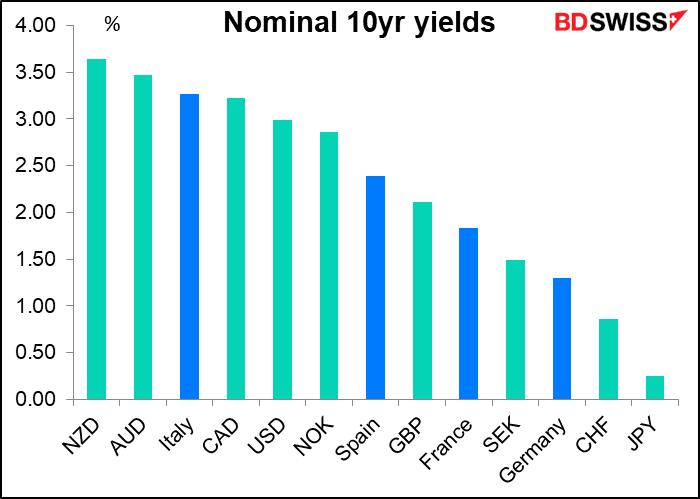
Peripheral Europe stacks up a bit better on a real yield basis, but still not compelling. And Germany, the highest-rated European borrower, looks just as unattractive on a real basis as on a nominal basis.
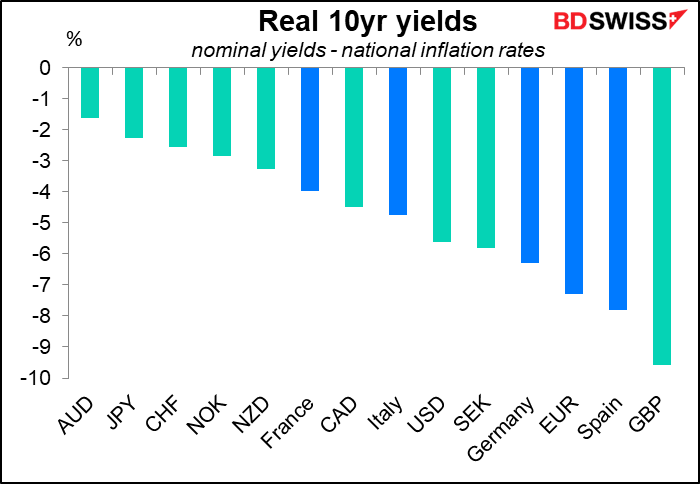
In short, with European energy prices soaring, it may take more of a concession on the currency to entice investors into European asset markets and keep the balance of payments balanced. A sub-parity EUR/USD may be in store.
Next week: US CPI & retail sales, RBNZ, Bank of Canada
There’s a lot on the schedule next week, none of which is on Monday and much of which is on Wednesday.
For the US, the focus will be on the consumer price index (CPI) on Wednesday and the retail sales on Friday.
The US CPI is forecast to follow the same pattern we’ve seen recently: the headline figure powering ever higher while the core measure (excluding energy and food) declines yet again. If the forecasts prove correct, this would be the third consecutive monthly decline in the year-on-year rate of increase in core inflation. Unfortunately the headline figure on the other hand is expected to rise still further,
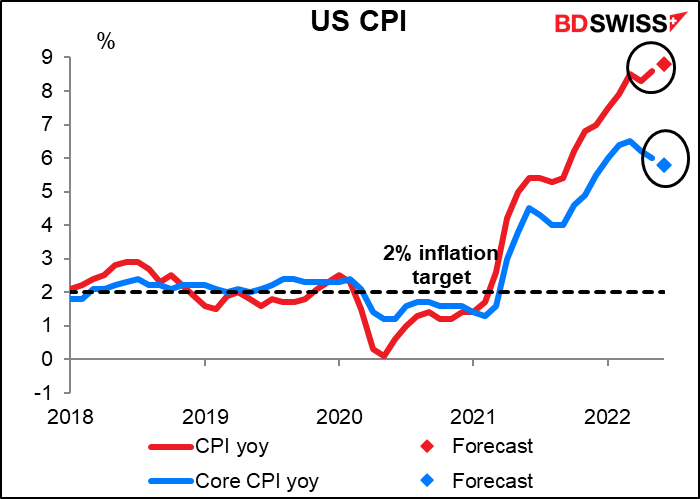
On the other hand…if we look at the annualized three-month change, which is perhaps a better reflection of what’s going on recently with inflation, the forecast there is the opposite: the headline figure is expected to slow while the core measure is forecast to rise.
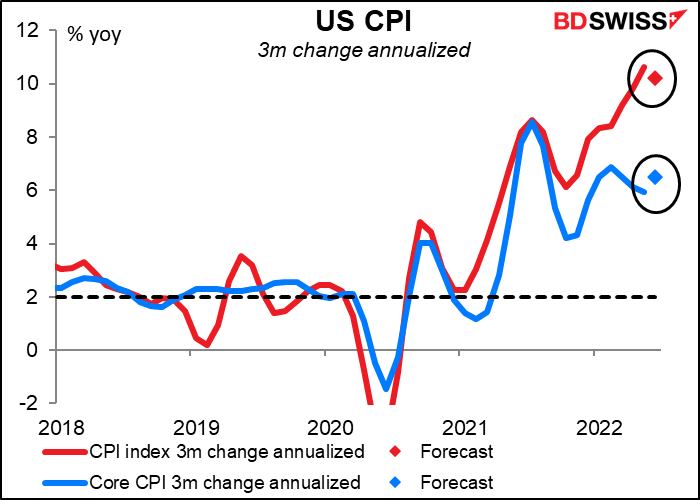
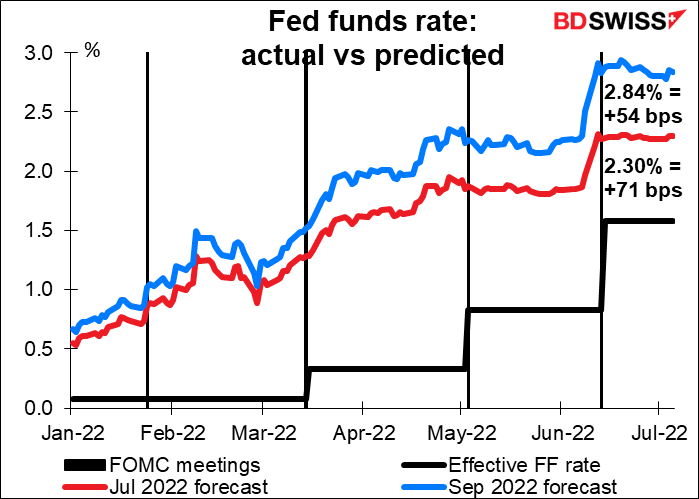
Put together, these two measures suggest that there’s no conclusive evidence that inflation is slowing, even at the core level. Fed Gov. Waller Thursday said he supports hiking rates by 75 bps in July and “probably” another 50 bps in September. With figures like this, I wouldn’t be surprised if many of his colleagues on the rate-setting Federal Open Market Committee (FMOC) agree with him.
That’s also what the market is forecasting. But if inflation shows no signs of decelerating, the odds of yet another 75 bps hike in September are likely to increase. USD+
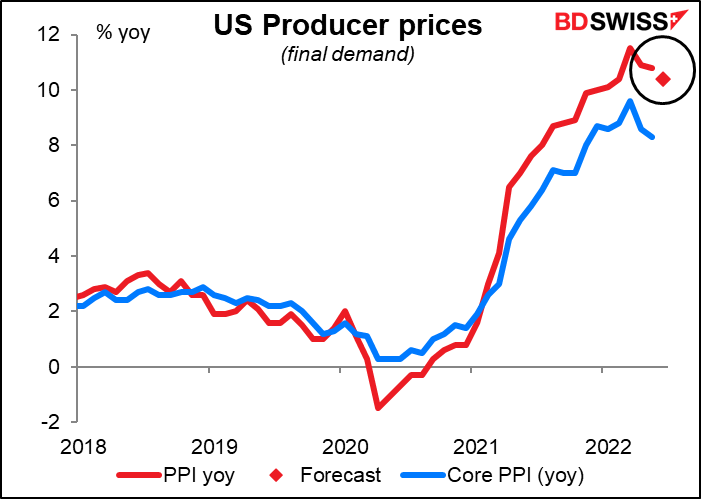
The US producer price index (PPI) comes out on Thursday. That is expected to show some slowing at the headline level, but I don’t think it will be enough to change anyone’s view on inflation.
As for the retail sales, it’s expected to be up 0.9% mom, which would be slightly higher than the six-month moving average of +0.7% mom. In other words, the US consumer remains healthy and willing to spend. That might help corroborate Gov. Waller’s (and other Fed officials’) view that fears of a recession are “overblown,” a view that St. Louis Fed President Bullard agreed with – he said the US has “a good chance of a soft landing.” Of course MRDA, as they say in Britain, but so far US consumption, which accounts for some 70% of the economy, is holding up.
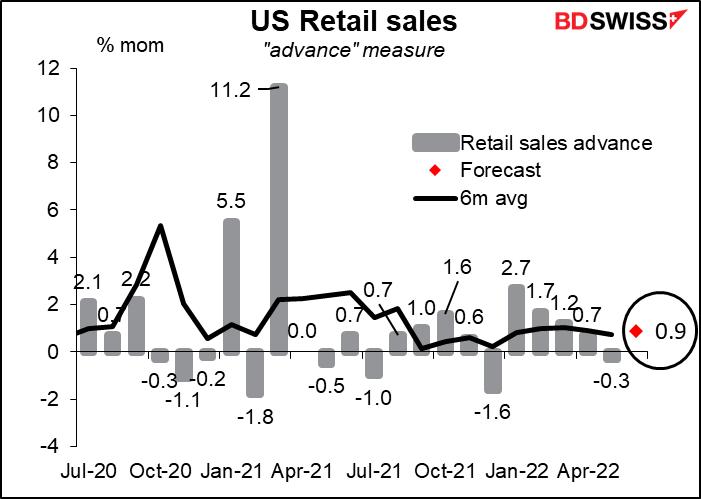
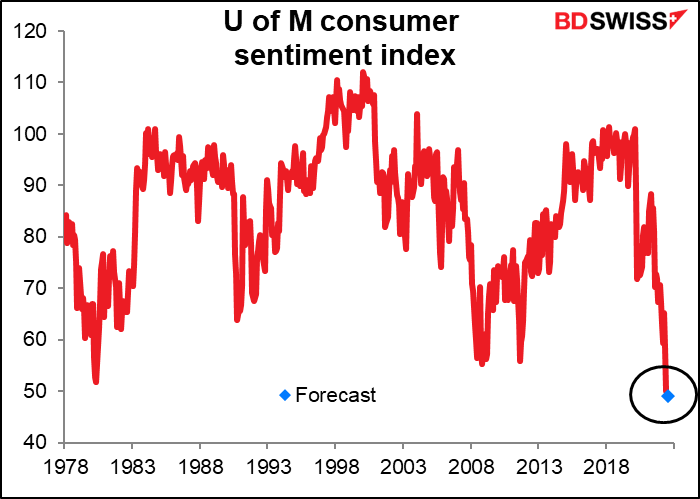
That’s in contrast to US consumer sentiment, which is in the doghouse. According to the University of Michigan consumer sentiment survey (Fri), consumer sentiment is already at a record low and the market expects it to go even lower. How can spending hold up so well when sentiment is so bad? In my view, the answer is that these sentiment surveys aren’t worth much. I haven’t been able to discern any correlation between sentiment as measured by these surveys and consumption subsequently, but maybe I’m just not looking properly.
Other important US indicators out during the week include the Empire State manufacturing index and industrial production on Friday, which will give us a feel for how the manufacturing sector is going. Also the Fed releases the Beige Book on Wednesday, as usual two weeks before the FOMC meets. That will give us the background to their meeting and may help us to know what to expect.
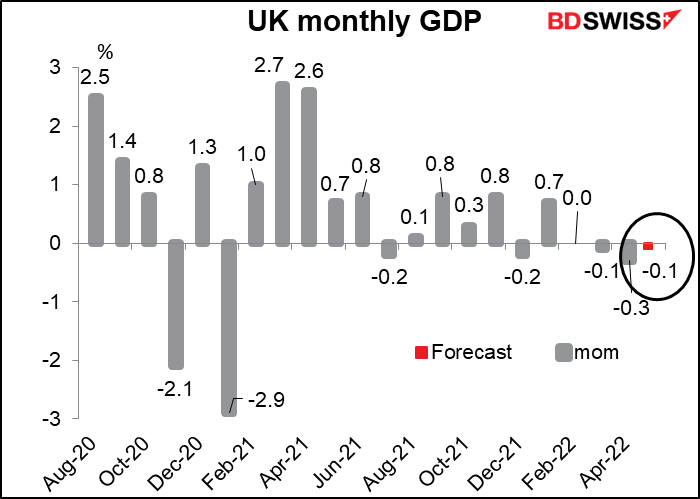
Wednesday is also “UK short-term indicator day” when the UK releases monthly GDP, industrial & manufacturing production, and the trade balance. The most important of these indicators, in my point of view, is the UK GDP. It’s expected to be down for the third month in a row. This will bring into sharp relief the conundrum the Bank of England faces as inflation soars while the economy crawls toward recession.
The figure could dampen what little enthusiasm there is for GBP right now, although given the rhetoric we’ve heard from the Bank of England recently, I think several members are willing to risk a recession if necessary to rein in inflation. But remember that uber-hawk Michael Saunders will be leaving the Monetary Policy Committee after the August meeting to be replaced by Dr. Swati Dhingra, who doesn’t seem to be as hawkish as Saunders. She might tip the balance in a close vote
Speaking of central banks, there are two major central bank meetings next week: the Reserve Bank of New Zealand (RBNZ) and the Bank of Canada (BoC), both on Wednesday.
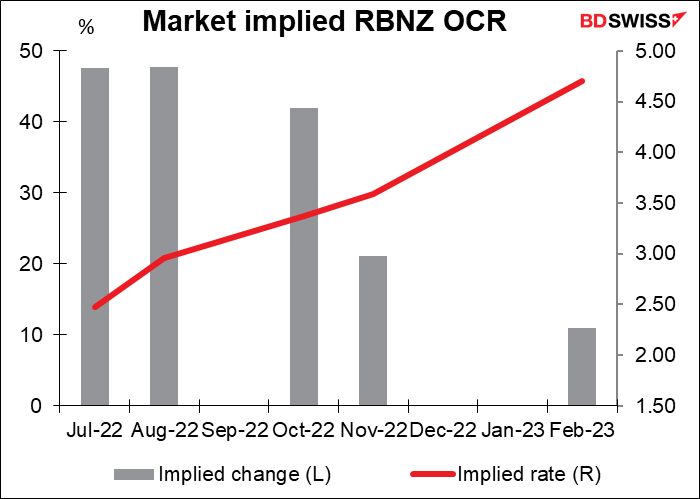
The market unanimously looks for a 50 bps hike in the RBNZ’s official cash rate (OCR) (18 out of 18 estimates in Bloomberg, plus the pricing of the overnight index swaps). Accordingly, anything outside of that would be a major shock, particularly as this is an interim meeting and therefore won’t be accompanied by any updated forecasts for inflation or growth.
The risk is that they tone down their statement somewhat as some of the recent data on economic activity has been on the soft side (EG building permits -8.5% mom in May, house sales -28.4% yoy in June, consumer confidence -2.2% in June, etc). A softer tone could reduce expectations for 50 bps hikes at the October and November meetings and dampen sentiment toward NZD.
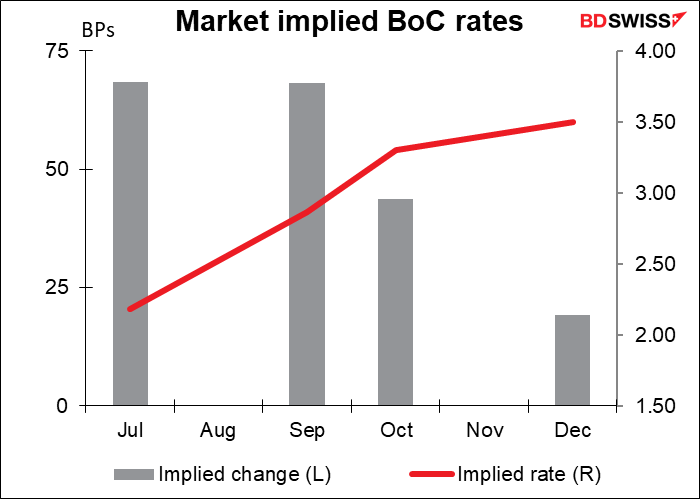
The market expects an even more hawkish tone from the Bank of Canada, where the market thinks 75 bps hikes in July and September are possible. This follows the 50 bps hike in June, when the Governing Council said in its statement that it “is prepared to act more forcefully if needed to meet its commitment to achieve the 2% inflation target.”
Here we see some divergence in views. The 16 forecasts in Bloomberg are clustered around 2.0%, i.e. a 50 bps hike, but three economists expect a 75 bps hike to 2.25%, while one — the anonymous forecaster at the Institute of Fiscal Studies and Democracy — is looking for a massive 100 bps hike to 2.5%. Meanwhile the overnight index swap (OIS) market is forecasting 2.34%, i.e. a 50 bps hike plus a good chance of a 75 bps hike. Same thing for September.
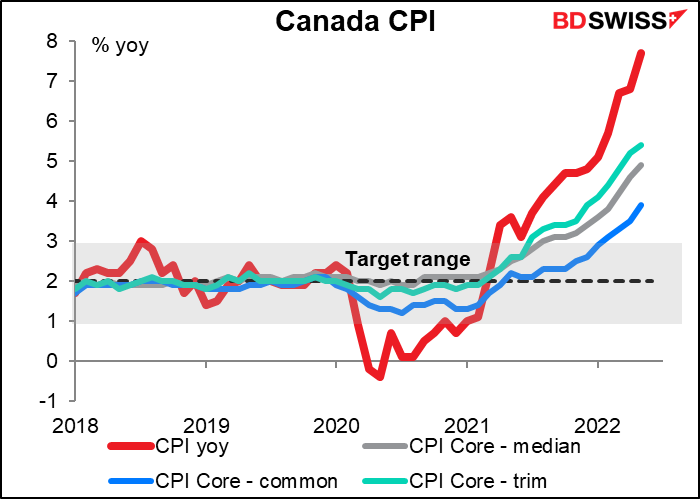
What are they likely to do? Well, May’s headline inflation surprised to the upside for a fifth straight month, rising to the highest level since 1983, while the annualized three-month change hit 14%, the highest since 1981.
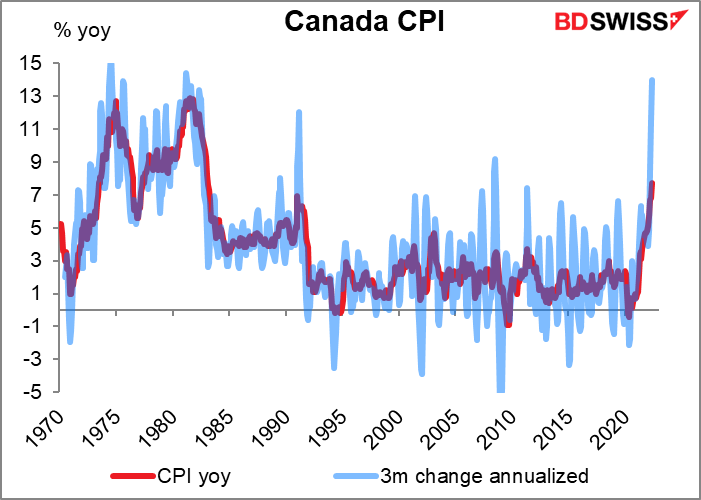
All three of the BoC’s core measures accelerated too.
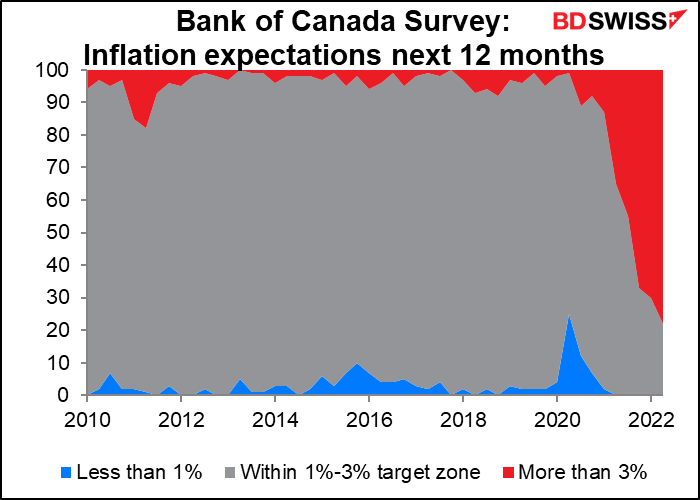
And according to the BoC’s quarterly survey, 78% of the people expect inflation to be above the BoC’s 1%-3% target zone over the next year, up from 70% three months ago. When two-thirds of the respondents have lost confidence in the Bank’s ability to hit its target, they have to do something aggressive lest they risk inflation expectations becoming unanchored. I therefore expect a 75 bps hike, which is likely to cause CAD to appreciate
Other important indicators out during the week: Japan has its producer price index (PPI) and the EU, the ZEW survey (both Tue). Australia employment comes out on Thursday. China releases its trade data (Wed) and its Q2 GDP, industrial production, retail sales, and fixed-asset investment (Fri).